
From raw measurements to results you can publish
You measured it; we process and interpret it. Send your files and get back results you can put straight into a thesis, paper or report.
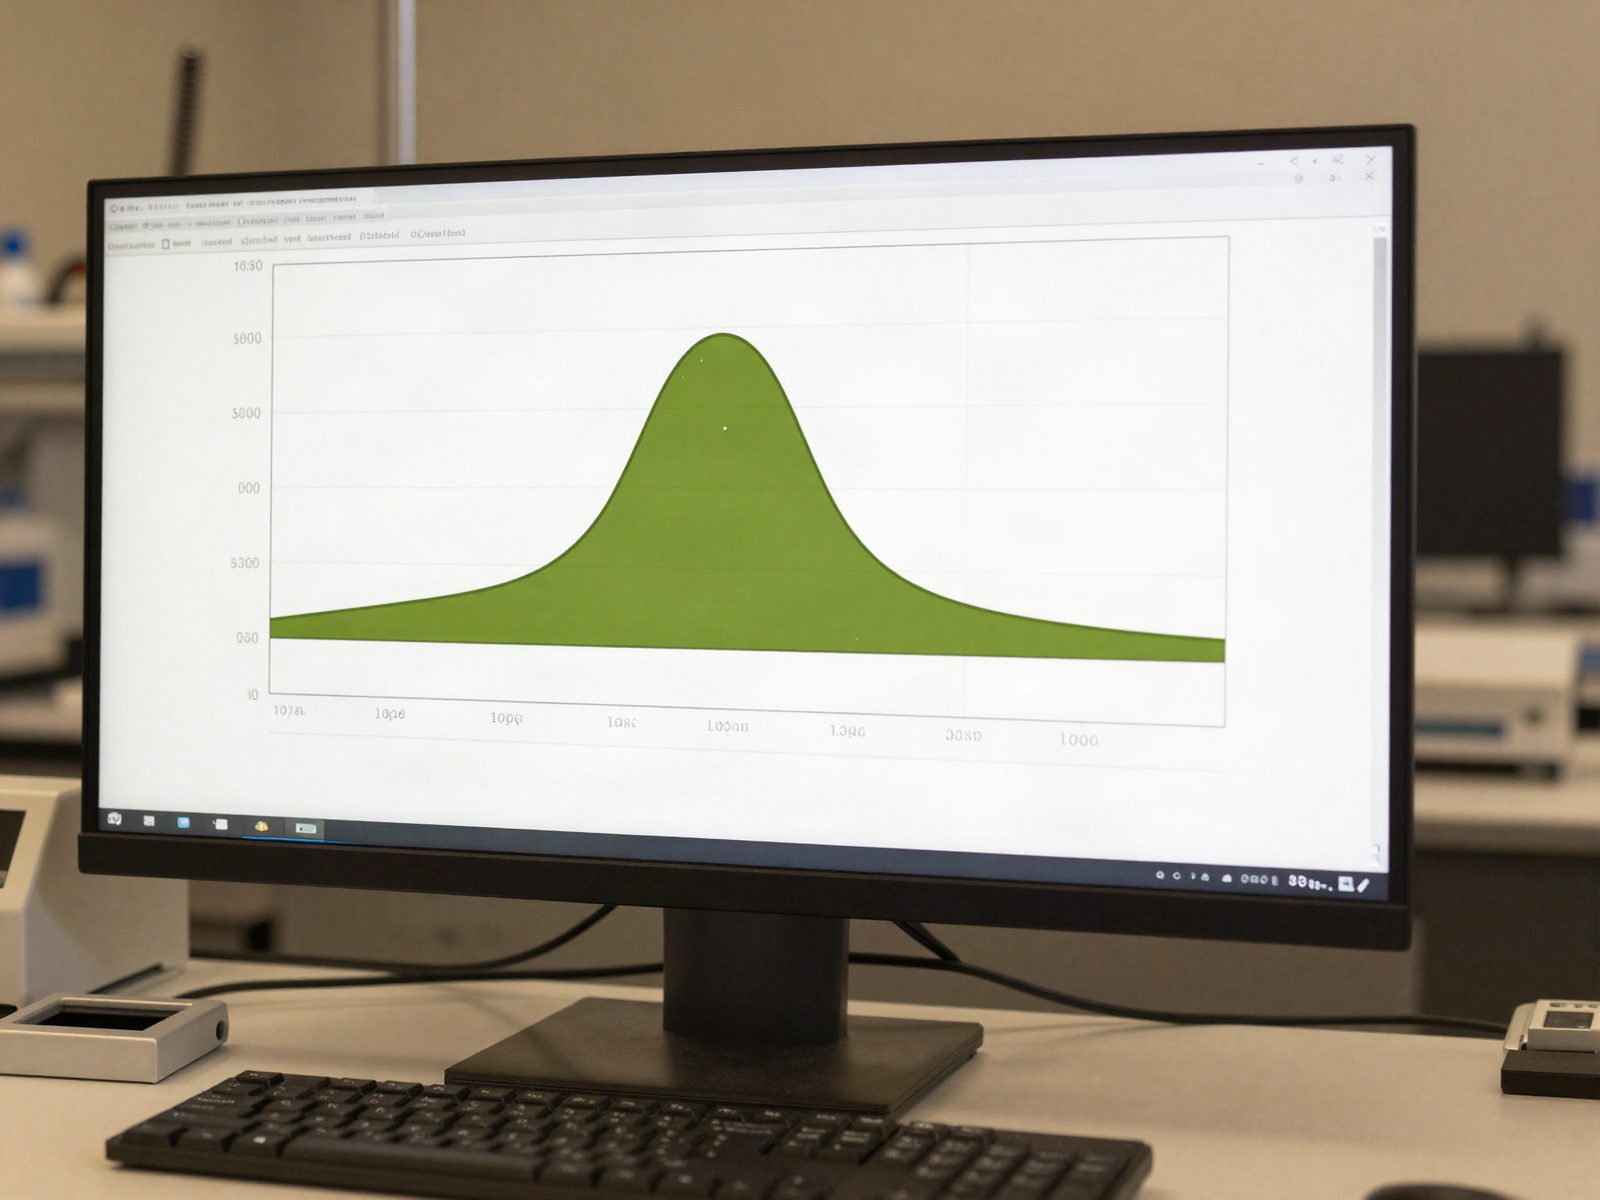
Every analysis includes
- Cleaned and processed data in CSV or Excel
- Extracted parameters with uncertainties
- Publication-quality figures in PNG and vector formats
- A short report explaining the methods, so you can describe them in your paper
- One revision round
Data we work with
XRD
Phase identification, peak fitting, Rietveld refinement, crystallite size and microstrain (Scherrer, Williamson–Hall), lattice parameters.
FTIR
Baseline correction, band assignment, functional-group identification, peak deconvolution.
UV-Vis
Absorption coefficient, optical band gap (Tauc analysis), Urbach energy, transmittance and reflectance.
Raman
Peak fitting, mode assignment, intensity ratios, crystallinity and defect indicators.
SEM / TEM
Particle and grain size distributions, morphology description, EDS composition summaries.
Ellipsometry
Optical model fitting, film thickness, refractive index and extinction coefficient dispersion.
TGA
Mass-loss steps, onset and decomposition temperatures, derivative (DTG) curves, residue and composition estimates.
AFM
Image levelling, surface roughness (Ra, Rq), grain and particle size, height profiles and 3D views.
SPR
Resonance curve fitting, resonance angle shifts, sensitivity, and layer thickness and optical constants from the fit.
Contact angle
Drop-shape fitting, static contact angles, wettability classification, surface free energy from measurements with several liquids.
Profilometry
Profile levelling, step height and film thickness, surface roughness parameters, comparison across samples.
XRF
Element identification, peak fitting and overlap correction, semi-quantitative composition, comparison across samples.
Have a different kind of data? Ask — if it is outside our expertise we will tell you so.
Have a project in mind?
Tell us what you need and get a fixed quote by email.